Path check
NOTE: This topic is only applicable to the following Robotics OLP products:
- Visual Components Premium OLP
- Visual Components Professional OLP
- Visual Components Robotics OLP
The path check functionality can be used to validate the robot program. It can interpolate the robot motions also between the statements. You can open the panel from Extras and Path setup. The path checker does not support the following special cases: multi-robot systems, changing the tool or workpiece geometry during the program, independently moving turntable.
To use the collision detection, you need to first create a collision detector with the robot and tool in the A list. Then the collision detector must be selected in the robot settings, see Setup tab.
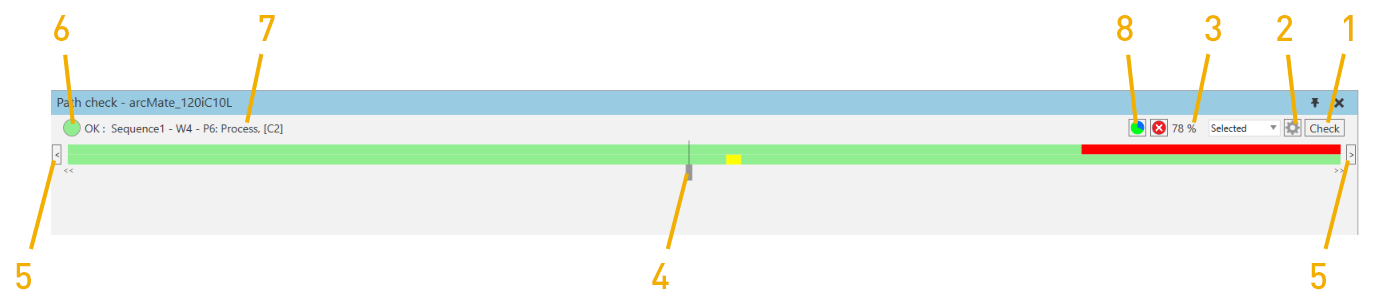
- Run the Path checker, and the upper and lower stripes show the path status along the path. The upper stripe shows the kinematic problems and the lower collisions:
- Green: Everything is OK
- Gray: Cannot check the area because of reachability problems nearby
- Orange: The target is unreachable
- Purple: TCP rotation over 180° during linear movement
- Red: Joint limits exceeded
- Blue: Singularity problem
- Yellow: Collision
-
Open the path checker settings window:
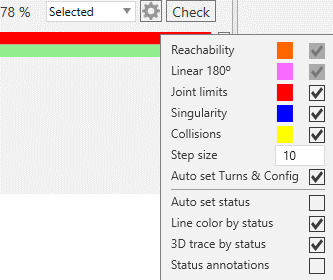
- Statements: You can check the whole program, current sequence, or selected statements
- Toggle if you want to check joint limits, singularity problems and collisions
- Step size: The accuracy of the interpolation
- Auto set Turns & Config always tries to guess the correct turn and configuration after each linear interpolation.
- Auto set status: See Auto set status
- After running the check, shows how big portion of the interpolation steps was OK.
- Drag the pin to move the robot along the checked path.
- Click the left and right arrow buttons to go to the previous or next interpolation step, that has different status than the current step.
- The color shows the status of the current interpolation step.
-
The text explains the status of the current step and shows the related sequence name and statement.
Note: You can click the text to select the statement in the program tree.
-
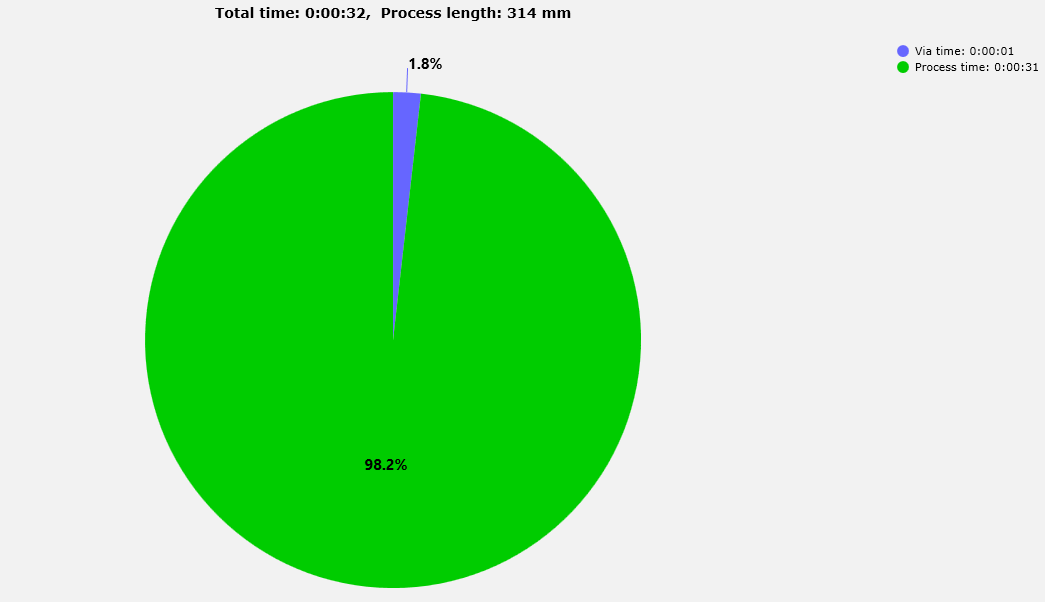
Show statistics graph: This shows the weld process statistics. Click this option to view a pie chart showing the amount of Via time and Process time and information about total time and the Process length (mm).
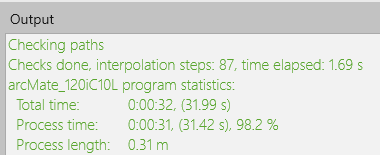
You can also view this information in the output tab like below: